登录
手机号码
+86
验证码
获取验证码
未注册的手机号验证通过后将自动注册


Bitcoin price started a downside correction from the $50,400 zone. BTC tested $48,250 and is currently attempting a fresh increase above $50,000.
Bitcoin price gained pace above the $48,800 resistance zone. BTC even spiked above the $50,000 resistance zone before the bears appeared. A new multi-week high was formed near $50,339 before the price corrected lower.
There was a move below the $49,500 and $49,200 levels. The price even dived below $49,000, but the bulls were active above the $48,250 support. A low was formed near $48,240 and the price is now moving higher. There was a move above the $48,800 zone.
Bitcoin cleared the 50% Fib retracement level of the recent decline from the $50,390 swing high to the $48,240 low. It is now trading above $48,850 and the 100 hourly Simple moving average.
There is also a key bullish trend line forming with support at $48,750 on the hourly chart of the BTC/USD pair. Immediate resistance is near the $49,880 level or the 76.4% Fib retracement level of the recent decline from the $50,390 swing high to the $48,240 low.
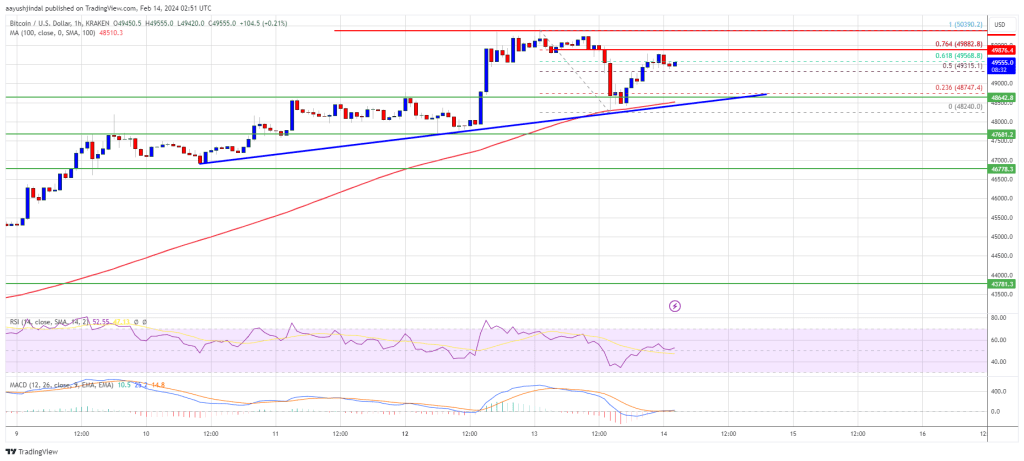
Source: BTCUSD on TradingView.com
The next key resistance could be $50,000, above which the price could start another decent increase. The next stop for the bulls may perhaps be $50,400. A clear move above the $50,400 resistance could send the price toward the $51,200 resistance. The next resistance could be near the $52,000 level.
If Bitcoin fails to rise above the $50,000 resistance zone, it could start another downside correction. Immediate support on the downside is near the $49,200 level.
The first major support is $48,800 and the trend line. If there is a close below $48,800, the price could gain bearish momentum. In the stated case, the price could dive toward the $47,800 support.
Technical indicators:
Hourly MACD – The MACD is now gaining pace in the bullish zone.
Hourly RSI (Relative Strength Index) – The RSI for BTC/USD is now above the 50 level.
Major Support Levels – $49,000, followed by $48,750.
Major Resistance Levels – $50,000, $50,400, and $51,200.