


作者:Web3探索者
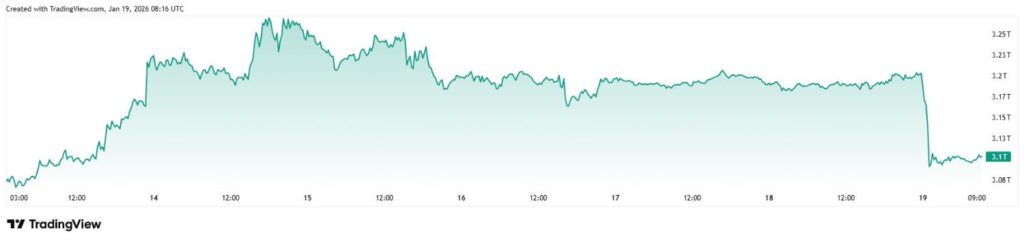
After a mostly strong start to 2026, the cryptocurrency market took a sharp turn late on Sunday, January 18, and wiped approximately $100 billion from its market cap in about 12 hours by press time on January 19.
Specifically, the total value of digital assets was holding steady near $3.2 trillion through most of the latest weekend, only to fall off a cliff and land close to $3.09 trillion at its very end, before partially recovering to $3.1 trillion.
Bitcoin, Ether, and XRP prices collapse with the crypto market
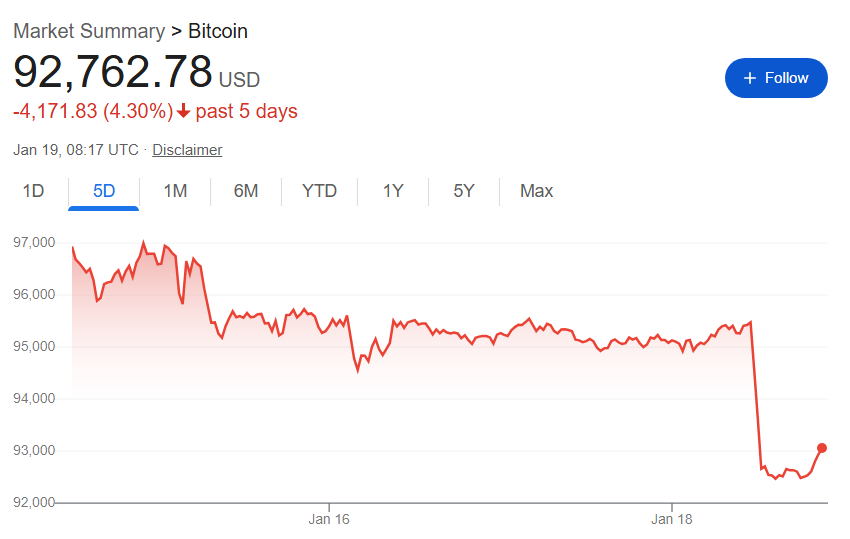
The same pattern is visible across multiple major cryptocurrencies. After promising to reclaim $100,000 for most of the previous week, Bitcoin (BTC) suddenly crashed 3% from above $95,000 on Sunday, to $92,762 at press time.
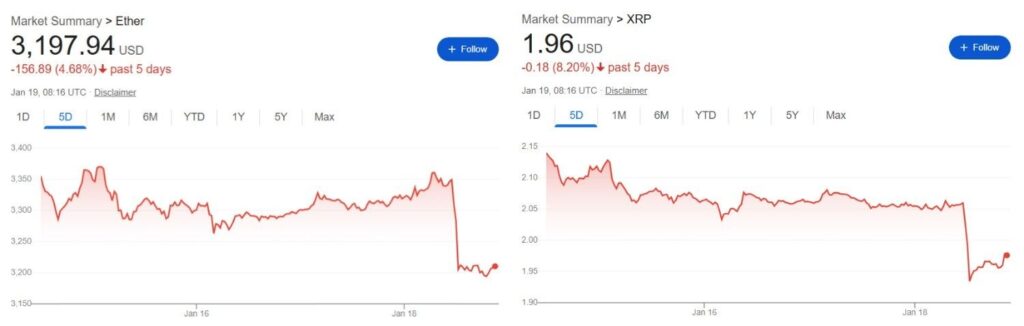
Similarly, Ethereum (ETH) collapsed 4.16% from $3,350 to $3,197, and XRP 4% from $2.06 to $1.96. Interestingly, the timing and the magnitude of the correction for the three digital assets – and for the overall cryptocurrency market – are almost carbon copies.
Why cryptocurrencies are crashing today
Data Finbold retrieved from CoinGlass reveals that the latest crash happened in a climate of relatively thin liquidity. Specifically, the blockchain analysis platform reveals that the latest rally – the upsurge that appeared to be driving Bitcoin back toward $100,000 was largely driven by investments in derivatives rather than a strong spot demand.
Under the circumstances, the downturn could serve as a herald for the next stock market open, as it could hint at a strong risk-off sentiment from the reignition of the trade war between the E.U. and the U.S. that occurred after President Donald Trump ordered the implementation of a 10% tariff on eight European countries opposed to the annexation of Greenland.
Commodity market movements appear to back such an interpretation. Specifically, the charts for silver and gold – the traditional ‘safe haven’ asset – look like inverted mirror images of cryptocurrencies.
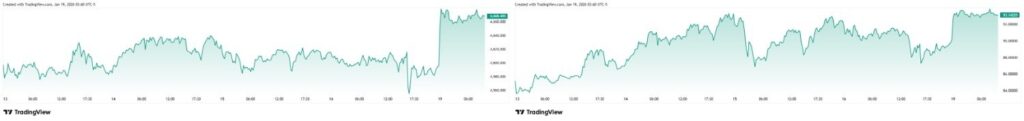
While digital assets were erasing $100 billion from their market capitalization in a sharp downward move, silver price soared 4.11% from $90 to a peak at $93.70, and gold price rallied 2.18% from $4,580 to $4,680.
Featured image via Shutterstock


No Comments